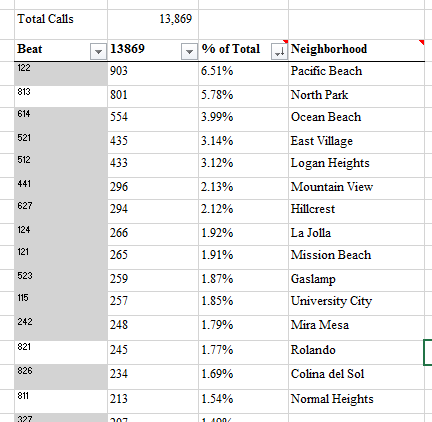
Awhile back I received a data set of all the Code 415N calls to San Diego Police Department for all properties in San Diego for a one-year period, 10/1/2014 – 9/30/2015. I believe 415N is the police department code for Disturbing The Peace. The data is for all property types, not only short-term rental properties. During the short-term rental debates there has been quite a bit of discussion about the crime and safety impacts that short-term rentals have on communities so it would seem a decent place to look for elevated impacts in areas with more short-term rental units.
I took the information and did some high level analysis of the complaint calls – the data file is included here and the notes / calculations I added are at the top right of attached file.
[Note: I didn’t have the TOT addresses to match to the 415N info (and the 415N info doesn’t have zip so I’m not sure how you match it unless they use the exact same address typing for both sets of data. I didn’t take a stab at it since it’s above my skill level to break that down. I’m also unsure of the completeness of TOT addresses since Airbnb now handles those remittances for hosts, so many are likely not registered with the City Treasurer.]
Some points I thought might be relevant to the ongoing discussion:
- Total calls in past year = 13,869. With city population of 1.381 million that comes out to 1% of the population making 1 call per year. I don’t know what a “good” nuisance reporting rate is, but if 1 of 100 people are calling once per year that seems pretty low.
- Average calls per district – with 9 districts the total number of complaints comes out to 4.22 calls per day. When thinking about enforcement needs, this seems a relevant point. I would think 1 hire per district could handle 4.22 calls per day, maybe 10 or 20 (I don’t know). At least a good point for talking about what resources are needed to handle complaint volume.

- Complaints by neighborhood – the data doesn’t match to exact addresses, but is useful in seeing where complaints are from by beat area and how that matches to the neighborhoods cited as being short-term rental problem spots. In the top 5 by % of complaints are: Pacific Beach (6.51%), North Park (5.78%), Ocean Beach (3.99%), East Village (3.14%), and Logan Heights (3.12%). Pacific Beach & Ocean Beach have had a lot of anti short-term rental sentiment, but not the other 3, maybe North Park if you include Burlingame. By address would be better to be more precise, but if you look at the Excel the neighborhoods that receive the most calls don’t correspond much to anti short-term rental sentiment, and I would guess correspond mostly to total population (which makes sense in general) than to perceived / actual short-term rental caused issues.
Wanted to share this information in case of interest to others. It seems a good touch point in the overall conversation so I thought worth posting.
Below is the Excel data set for download / use.
I can help geocode these records to get more accurate locations.
I’d be interested in seeing the 2010 number, aka pre-Airbnb, to see if there has been any change. That would be pretty cool.
Jerry T Good idea, Jerry – I’ll see if I can get that info and do the same breakdown by beat. Cheers!
aisaak Thanks for the offer! Without TOT information to separate short-term rentals from long-term / owner-occupied not sure there’s lot of value there. Will keep in mind.